

The Fortress Illusion:What NFL home field is actually worth
What 7,014 games say home field is actually worth. First for the whole league, then stadium by stadium, where the surprises live.
Ask ten football bettors what home field advantage is worth, and at least nine will give you the same answer: three points. Ask where that number came from, and you will get a shrug. It is one of those numbers everybody knows and nobody has checked.
So we checked. Every NFL game from 2000 through 2025. That is 7,014 games.
Here is the short version. Home field is not worth three points. It is worth about 2.3. It disappeared once, came back, and the betting market only priced the disappearance. And most of what you believe about specific stadiums turns out to be a belief about the teams that played in them, not the buildings.
The long version follows. It is worth your time, because the gap between what home field is worth and what the market charges for it is now the widest it has been in 26 years.
Separating the stadium from the roster
The obvious way to measure home field is to average the home team's margin of victory across every game. Do that and you get about 2.4 points. It is also close to useless, because a raw average cannot tell the difference between a stadium and the people employed inside it.
Here is the problem in one example. From 2002 to 2025, New England's average home margin was 8.89 points, the biggest in football. Was that Foxborough? Or was that the guy taking the snaps for twenty of those years?
To answer that, you need a regression. Do not let the word scare you. A regression is just a careful way of asking one question: holding everything else equal, what does this one thing do? We took the home margin of every game and controlled for five things that are not the stadium:
| What we controlled for | Effect on home margin | Is it real? | Plain English |
|---|---|---|---|
| Home field itself | +2.31 pts | Yes (t = 14.3) | The answer we were looking for |
| Team strength (Elo) | +0.034 pts per Elo pt | Yes (t = 20.0) | Better teams win by more |
| Team form (net EPA) | +6.84 pts per 1.0 EPA/play | Yes (t = 6.1) | Hot teams win by more |
| Rest edge | +0.20 pts per day | Yes (t = 3.1) | Small but real |
| Wind | -0.01 pts per mph | No (t = -0.4) | Nothing |
| Temperature | -0.02 pts per degree | Yes (t = -2.1) | Cold helps the home team a little |
Two quick translations. A t-stat measures how confident we can be that an effect is real and not luck. Above 2 is solid. At 14, the odds of a fluke are basically zero. And because every input is centered on its average, the home field number reads exactly the way you want it to: how much the home team wins by when two evenly matched teams play in normal conditions. No Brady dragging the average up. No twelve-year rebuild dragging it down. Just the building, the travel, the crowd, and whatever else comes with sleeping in your own bed.
One piece of honesty before we go on, because we would rather you hear it from us. This model explains about 15 percent of the variation in NFL scores. The other 85 percent is the bounce of the football. That is not a flaw in the model. That is an accurate description of the sport. Any model that claims to explain most of an NFL game is fooling itself, or you. The average miss is 13.5 points per game. Keep that number in your head. It is the single most important number in this article, and it comes back later.
What home field is actually worth
Across all 26 seasons, home field advantage is worth 2.31 points. Statistically, this is about as certain as anything in football gets.
It is also 0.7 points below the number in your head. The first finding of this whole exercise is that the folklore price was marked up before you ever made a bet.
What does 2.31 points feel like? Two ways to see it. In spread terms, it is the difference between a pick'em and a field goal favorite, minus the hook. In win terms, a 2.31 point head start against 13.5 points of noise means the home side of an even matchup should win about 56.8 percent of the time. The actual home win rate across all 7,014 games: 56.3 percent. The model and the scoreboard agree almost exactly, which is the kind of boring consistency you want from a regression.
Here is a wrinkle worth noticing. At the league level, all those controls barely change the answer. Raw home field and adjusted home field track each other closely in most seasons, because across 267 games a year, good and bad teams even out. The controls do not matter much for the league.
They matter enormously for individual stadiums, where they move some venues by four or five points. We will get there. First the small stuff, then the strange part.
The small stuff: rest, wind, and cold
The side findings are worth a minute, because people pay real money elsewhere for worse versions of these numbers.
Rest is worth about 0.20 points per day. Real, and modest. A team coming off a mini-bye holds roughly half a point over a team on normal rest. A full bye against a short-week opponent stretches toward a point and a half, though we would not push that math too far at the extremes. What rest is not worth is the two or three points your group chat charges every time somebody plays on a Thursday. The edge exists. It is a garnish, not a meal.
Wind is worth nothing. The effect is a rounding error, and the t-stat says stop asking. Wind changes totals and it ruins punts. It does not change who wins by how much, because both teams play in it. Sixty years of sideline shots of flags whipping around, and the effect on the spread is zero.
Cold helps the home team, a little. About 0.02 points per degree. A game played 30 degrees below normal is worth roughly two thirds of a point to the hosts. The frozen tundra, finally priced: less than a field goal, more than a story. Green Bay's actual number is coming later, and it does not need December's help to be impressive.
One season can fool you
Before we get to the year home field disappeared, you need one piece of math. It is simple, and it will protect you from half the bad takes ever written on this subject.
The average game misses expectations by 13.5 points. A season has about 267 games. Put those together and a single season's home field number comes with a margin of error of about plus or minus 0.8 points, and sometimes more. Which means a true home field of 2.3 will randomly print seasons anywhere from 1 to 4 through pure luck. No cause. No trend. No explanation needed.
You can see it in the record. In 2006, home field printed 1.00 raw, one of the lowest readings of the whole era. Did stadiums get quieter that year? Did road travel suddenly get easier? No. It was noise, and it proved it was noise by bouncing back to 2.93 the very next season without anyone doing anything.
Nobody declared home field dead in 2006, for a simple reason: there was no story available to attach to it.
Remember that. It is the control group for what happened next.
The year home field disappeared
In 2019, home field advantage in the NFL was 0.04 points. Basically zero. Home teams won 52.3 percent of their games, barely better than a coin flip.
Look at that date again. 2019. Full stadiums, full parking lots, full face-painted crowds. The collapse happened a year before anyone had heard of social distancing.
Then 2020 arrived. The stands actually emptied, home field stayed at zero, home teams went exactly .500, and suddenly everyone had an explanation: crowds are the mechanism, no crowds means no home field, mystery solved. Papers were written. The empty-stadium experiment became one of the most cited findings in sports analytics.
There is just one problem with the story: the timeline. Home field collapsed while the crowds were still in the building. The explanation showed up twelve months after the thing it claims to explain.
This is one of the oldest traps in forecasting. We are wired to find explanations, and once we find a good one, we stop checking whether it fits all the evidence instead of just the most recent piece. The crowd story fits 2020 perfectly. It does not fit 2019 at all. A useful rule: when a story explains the second data point but not the first, be suspicious of the story.
By the math from the last section, 2019 should have been treated like 2006: a weird season that means nothing on its own. Instead it got welded to 2020 and upgraded into a new era.
Was it one? Now we know the answer.
The comeback the market missed
Home field came back in 2021 and never left. Over the last five seasons it has averaged 2.25 points. Over the last three, 2.41. Home win rates are back in the mid-fifties. By every measure we have, football returned to its old normal five years ago.
The price never did.
| Era | Seasons | Games | Raw HFA | Adjusted HFA | Market HFA | Raw minus Market | Home ATS |
|---|---|---|---|---|---|---|---|
| Full-crowd era | 2000-2018 | 5,055 | 2.56 | 2.60 | 2.47 | +0.08 | 48.9% |
| Collapse | 2019-2020 | 536 | 0.11 | -0.04 | 1.52 | -1.41 | 46.8% |
| Post-COVID | 2021-2025 | 1,423 | 2.25 | 2.15 | 1.69 | +0.57 | 50.1% |
| Last 3 seasons | 2023-2025 | 855 | 2.41 | 2.35 | 1.60 | +0.81 | 50.8% |
Look at the first row, because it is a compliment. For nineteen years, home field was worth 2.56 points and the market charged 2.47. A gap of eight hundredths of a point across five thousand games. The betting market is one of the best forecasting machines humans have ever built, and for two decades it had this number nailed. If anything it charged a touch too much, which is why home teams covered only 48.9 percent in that era, and why every "bet all home dogs" system from the 2000s eventually starved its inventor.
Then the collapse hit, and the market cut its number. Fair enough. You should update your beliefs when the evidence changes.
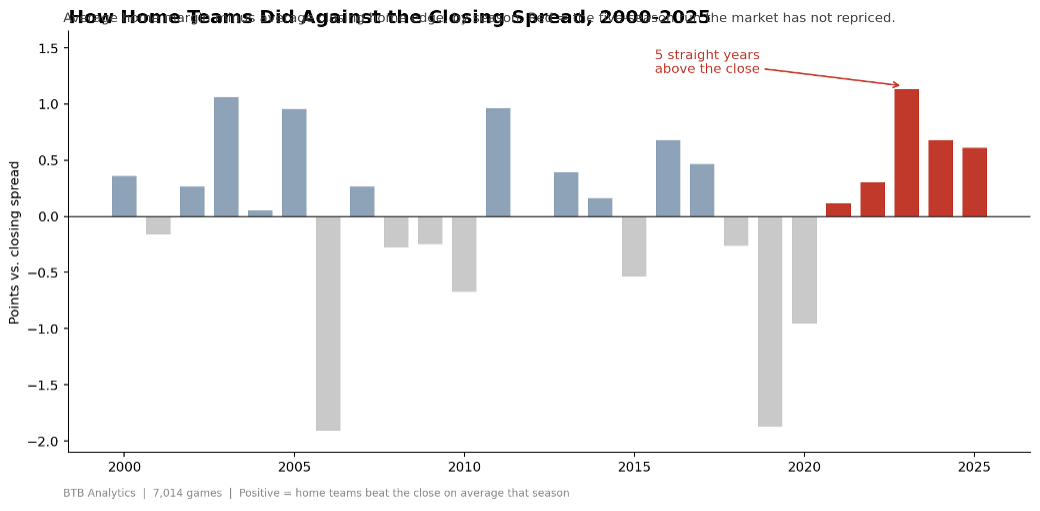
The strange part is what happened when the evidence changed back. Home field returned in 2021. The market's number kept falling anyway: 1.82 in 2021, then 1.80, then 1.79, then 1.60, then 1.42 in 2025. The market has cut its home field price every single year since 2021, while the thing it was pricing sat in plain sight at 2.3 the whole time. The 2025 price is the lowest of any full-crowd season in the entire 26-year sample. The only season ever priced lower was 2020, when the seats were literally empty.
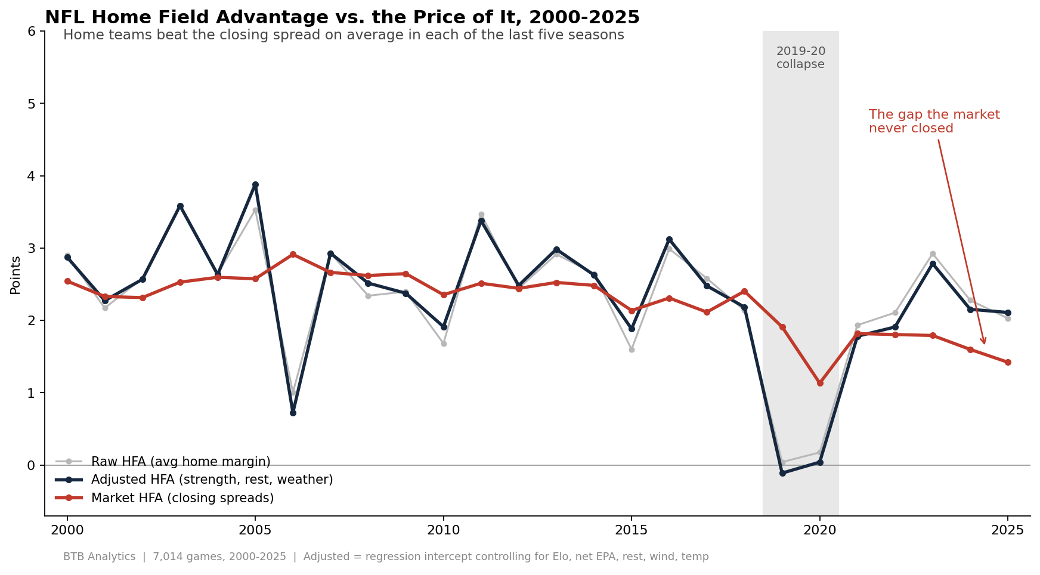
The result is the widest sustained gap between reality and price in a quarter century of data. Home teams have beaten the closing spread, on average, in each of the last five seasons, and by 0.81 points per game over the last three.
There is a name for the right way to handle evidence like this: Bayesian updating. Strip away the math and it means something simple. You start with what you believe, you look at the new evidence, and you move your belief by an amount that matches how strong the evidence is. Two weird seasons, one of them missing its customers entirely, is weak evidence of a permanent change. Five straight seasons of the old pattern is strong evidence that nothing permanently changed.
The market did the opposite. It moved a lot on the weak evidence and has not moved at all on the strong evidence. It updated in one direction and then stopped. Good forecasters update in both directions. That is the whole trick, and for five years now, on this one number, the best forecasting machine in sports has not been doing it.
The market buried home field in 2020. Five years later it is still leaving flowers at the grave, and the body is up 0.8 a game.
Why you still can't just bet home teams
Now the part a tout would delete, and we will not, because it is the difference between this site and the ones with the Lamborghini photos.
That 0.81 point gap over the last three seasons lifted the home cover rate to 50.8 percent. The p-value on that is 0.63, which in plain English means a result this size shows up by dumb luck all the time. You need 52.4 percent to beat the standard vig. Blindly betting every home team since 2023 would have meant sweating 855 games to roughly break even before the juice and lose after it.
How can an edge be real and still not pay? Here is the arithmetic that should get tattooed somewhere permanent.
Think of every NFL game as a radio message: about one point of signal buried in thirteen and a half points of static. Even if the 0.81 point edge were perfectly real and perfectly steady, shifting a 13.5 point noise distribution by 0.81 points moves your expected cover rate to almost exactly 52.4 percent. Read that again. The biggest systematic mispricing in football, the widest gap in 26 years of data, lifts you, at best, to the exact break-even line of a -110 bet. And the real-world number, 50.8, comes in under even that, because football scores are lumpy. They pile up on 3 and 7, and a fraction of a point of average edge does not convert cleanly into extra covers.
So who does an 0.8 point edge pay? The sportsbook. A book settles millions of bets, so it gets to live at the average, and at that scale 0.8 points is serious money. You settle one bet at a time, so you live in the noise. Poker players know this exact problem: a small skill edge is real, but it only shows up over thousands of hands, and the rake eats most of it. In betting, the vig is the rake, and it is bigger than this edge.
This is the difference between a fact about the league and a system for you, and a large share of the sports betting industry is built on customers who cannot tell those apart.
We wrote about this distinction in Price Matters and CLV Is King. Edges this size are ingredients. They shade a power rating. They move your own number half a point. They tip a lean into a play when they stack with other edges at the right price. What they are not, by themselves, is the play. Anyone selling "hammer home teams" as a product is selling you variance with a subscription fee.
So no, the takeaway is not to bet every home team. The takeaway is that the single biggest standing input in football pricing has been drifting for five years, and if your personal number still says three, or still says what 2020 said, you are wrong in opposite directions and paying for both mistakes.
The fortress illusion
At the league level, the controls barely mattered. Stadium by stadium, they change everything, because raw home splits are mostly team-quality illusions, and every one of them has a fan base and a broadcast crew emotionally invested in not finding out.
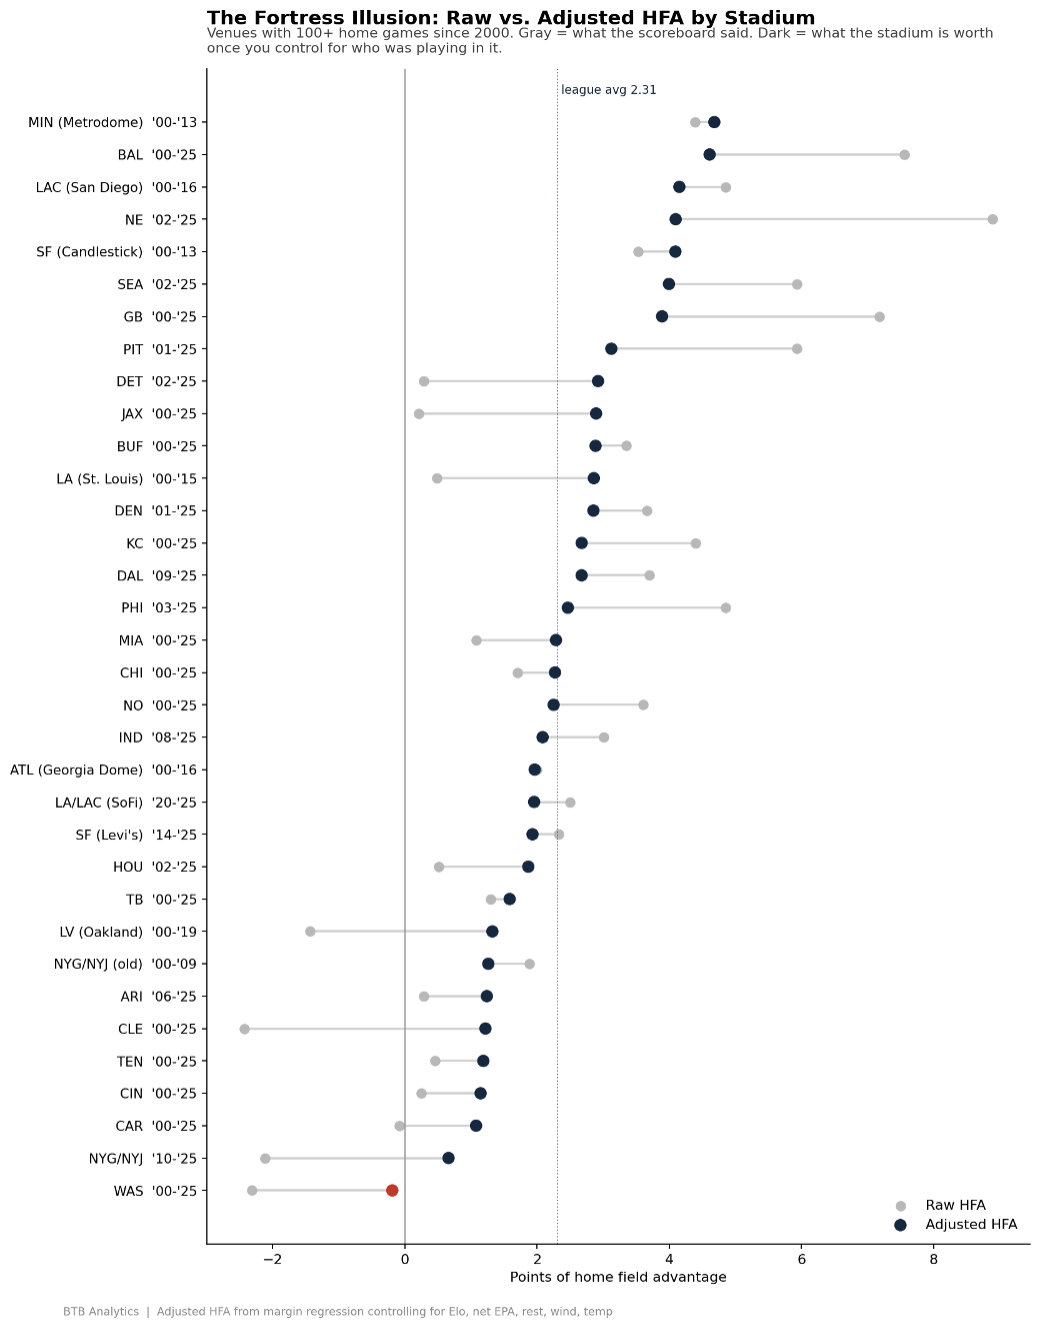
Start with New England. Raw home edge: 8.89 points, the biggest in football, the fortress of the era. Adjusted for who was on the roster: 4.10. Foxborough is genuinely elite, fourth best in the sample. But more than half the fortress was a quarterback. The moat wore number 12, and when the moat signed with Tampa, the walls turned out to be regulation height.
Now run it the other way, because this is the more useful lesson. Cleveland's raw home number is negative 2.43, the worst in the sample, the kind of stat that launches a thousand jokes. Adjusted: positive 1.22. The stadium was never the problem. The rosters were, and those rosters were just as bad on the road, which is the part a raw split can never show you.
Detroit and Jacksonville are the two illusions worth actual money, because both are still standing and still mispriced in the public's head. Their raw numbers are 0.29 and 0.21. Invisible. Punchline venues. Their adjusted numbers are 2.92 and 2.89, ninth and tenth best in the sample, ahead of Arrowhead, ahead of Denver, ahead of every California building ever measured. Ford Field is a genuinely loud dome that spent two decades hosting a team nobody feared, and the two facts got averaged together. Same story in Jacksonville, with humidity instead of a roof.
The same math cuts famous reputations down elsewhere. Philadelphia's raw 4.85 adjusts to 2.47: about half the Linc's menace was the teams playing in it. New Orleans, raw 3.61 across all those deafening Brees-era Sundays, adjusts to 2.25, a hair below league average. The dome was loud. The offense was louder.
The real list, the dead list, and the altitude myth
The strongest venues of the last 26 years, adjusted for everything: the Metrodome (4.68), Baltimore (4.61), old San Diego (4.15), Foxborough (4.10), Candlestick (4.09), Seattle (4.00), and Green Bay (3.89).
Now notice what is missing from that list, because the gap between reputation and measurement is where bettors lose money.
Denver, the most talked-about home field in American sports, comes in at 2.85. Thirteenth out of thirty-four. The altitude ranks behind three stadiums that have since been demolished. Sixty years of broadcast copy about thin air and oxygen tanks on the visiting sideline, and the measured effect could not outlast the buildings it was compared to. It gets worse for the legend: the market has historically charged 3.75 for Denver home games, which makes the altitude one of the few famous venues the market has actually overpaid for. Across 214 games, Denver home teams underperformed the closing number.
Arrowhead holds the Guinness world record for crowd noise. The decibels rank fourteenth, at 2.68, behind Jacksonville, whose crowd holds no records of any kind. Loudness is easy to measure. Loudness turning into points is a separate claim, and the data politely declines to endorse it.
Could we tell you why Baltimore is worth 4.6, or why a Minneapolis dome with a Teflon roof beat a mile of elevation? We could make something up about acoustics and sight lines, and it would sound great. We will pass. The honest answer is that we know the number is big, steady, and survives every control we throw at it, and we do not fully know why. In this business, knowing what without knowing why is a perfectly good living. Knowing why without checking what is how you end up paying 3.75 for altitude.
At the bottom, the dead list: Washington (-0.19), MetLife (0.66), Carolina (1.08), Cincinnati (1.15), Tennessee (1.19), Cleveland (1.22). Washington is the only venue in the sample worth negative points at home. Twenty-six years of data, and the statistically correct move for the home team is to request a neutral site.
The roommate problem
One pattern at the bottom of the table repeats too cleanly to ignore. Every stadium in the sample that houses two teams sits in the bottom third. SoFi, shared by the Rams and Chargers: 1.96, rank 22. Old Giants Stadium, shared by the Giants and Jets: 1.26, rank 27. MetLife, same two tenants: 0.66, rank 33, the worst active home field in football by a comfortable margin.
Three shared buildings. Three below-average numbers. Zero exceptions.
We could offer stories: half the crowd is neutral, the building belongs to nobody, road teams visit twice a year and know the locker rooms. Pick whichever you like. The pattern is the point. In 26 years, no team splitting a stadium with a roommate has gotten full value out of it. When your number for a Rams, Chargers, Giants, or Jets home game includes home field, it should be a small one, whatever the broadcast says about the crowd.
New stadium, new number? A note on Buffalo
The sample contains two cases where a team replaced its stadium with enough games on both sides to compare. Both point the same direction.
San Francisco left Candlestick, the fifth best home field ever measured at 4.09, and moved forty miles to Levi's in 2014. The new building: 1.93. More than two points of home field did not make the trip. The Giants and Jets tore down Giants Stadium (1.26) and opened MetLife next door in 2010. The new building: 0.66. Two stadium swaps, two declines, and not one example anywhere in 26 years of a new building opening stronger than the one it replaced.
Two data points is not a law, and both come with an asterisk. Levi's involved an actual move away from the fan base, and both Meadowlands numbers carry the roommate discount. Treat it as a lean, not a verdict.
Why bring it up this week? Because Buffalo just opened its new stadium across the street from the old one, and the first home game is Thursday night against Detroit. Old-stadium Buffalo measured 2.89, eleventh in the sample, a genuine top-third home field built on wind, cold, and hostility. The new building seats about ten thousand fewer people, and every game in it will be a brand new data point in a column that currently has none. The market will price Bills home games this season using the old barn's reputation. The small, imperfect history says new buildings open cheaper than the ones they replace. Nobody actually knows. That is the interesting part: for the first time in years, there is an NFL venue where the market is quoting a number backed by zero observations. We will be watching that one with the calculator out.
| Rank | Venue | Seasons | Games | Raw HFA | Adjusted HFA | Market HFA | Raw minus Market |
|---|---|---|---|---|---|---|---|
| 1 | MIN (Metrodome) | 2000-2013 | 112 | +4.39 | +4.68 | +3.15 | +1.25 |
| 2 | BAL | 2000-2025 | 221 | +7.56 | +4.61 | +4.83 | +2.73 |
| 3 | LAC (San Diego) | 2000-2016 | 141 | +4.86 | +4.15 | +3.87 | +0.99 |
| 4 | NE | 2002-2025 | 219 | +8.89 | +4.10 | +6.51 | +2.38 |
| 5 | SF (Candlestick) | 2000-2013 | 115 | +3.53 | +4.09 | +1.96 | +1.57 |
| 6 | SEA | 2002-2025 | 208 | +5.93 | +4.00 | +4.35 | +1.58 |
| 7 | GB | 2000-2025 | 224 | +7.18 | +3.89 | +5.25 | +1.93 |
| 8 | PIT | 2001-2025 | 218 | +5.93 | +3.12 | +4.30 | +1.63 |
| 9 | DET | 2002-2025 | 201 | +0.29 | +2.92 | +0.08 | +0.20 |
| 10 | JAX | 2000-2025 | 205 | +0.21 | +2.89 | +0.43 | -0.22 |
| 11 | BUF | 2000-2025 | 211 | +3.35 | +2.89 | +2.39 | +0.95 |
| 12 | LA (St. Louis) | 2000-2015 | 130 | +0.48 | +2.86 | +1.48 | -0.99 |
| 13 | DEN | 2001-2025 | 214 | +3.66 | +2.85 | +3.75 | -0.09 |
| 14 | KC | 2000-2025 | 226 | +4.40 | +2.68 | +3.52 | +0.88 |
| 15 | DAL | 2009-2025 | 145 | +3.70 | +2.68 | +3.49 | +0.21 |
| 16 | PHI | 2003-2025 | 201 | +4.85 | +2.47 | +4.40 | +0.46 |
| 17 | MIA | 2000-2025 | 213 | +1.08 | +2.29 | +1.21 | -0.13 |
| 18 | CHI | 2000-2025 | 210 | +1.70 | +2.27 | +1.01 | +0.70 |
| 19 | NO | 2000-2025 | 213 | +3.61 | +2.25 | +3.81 | -0.20 |
| 20 | IND | 2008-2025 | 153 | +3.01 | +2.08 | +2.50 | +0.51 |
| 21 | ATL (Georgia Dome) | 2000-2016 | 141 | +2.00 | +1.96 | +2.65 | -0.65 |
| 22 | LA/LAC (SoFi) | 2020-2025 | 104 | +2.50 | +1.96 | +2.97 | -0.47 |
| 23 | SF (Levi's) | 2014-2025 | 103 | +2.33 | +1.93 | +2.55 | -0.22 |
| 24 | HOU | 2002-2025 | 205 | +0.51 | +1.87 | +0.71 | -0.20 |
| 25 | TB | 2000-2025 | 217 | +1.29 | +1.59 | +1.97 | -0.68 |
| 26 | LV (Oakland) | 2000-2019 | 160 | -1.44 | +1.32 | +0.02 | -1.46 |
| 27 | NYG/NYJ (old) | 2000-2009 | 166 | +1.89 | +1.26 | +2.83 | -0.94 |
| 28 | ARI | 2006-2025 | 171 | +0.28 | +1.24 | +0.87 | -0.58 |
| 29 | CLE | 2000-2025 | 210 | -2.43 | +1.22 | -0.92 | -1.51 |
| 30 | TEN | 2000-2025 | 215 | +0.46 | +1.19 | +1.38 | -0.93 |
| 31 | CIN | 2000-2025 | 215 | +0.25 | +1.15 | +1.22 | -0.97 |
| 32 | CAR | 2000-2025 | 216 | -0.09 | +1.08 | +0.80 | -0.89 |
| 33 | NYG/NYJ | 2010-2025 | 263 | -2.12 | +0.66 | -1.01 | -1.11 |
| 34 | WAS | 2000-2025 | 213 | -2.31 | -0.19 | -0.12 | -2.20 |
Venues with 100+ home games, 2000-2025. Adjusted HFA controls for rosters, rest, and weather.
A quick guide to reading it, because two of these columns answer different questions, and mixing them up is how bad tweets get made. Adjusted HFA is what the venue itself is worth with rosters stripped out. It is the only column corrected for team strength. Raw minus Market is history: how home teams actually did against the closing spread in that building, rosters included. Baltimore home teams beat the close by 2.73 points a game across 221 games. Washington home teams lost to it by 2.20. Neither column is a pick. Both are ingredients. And we hold the stadium numbers to a higher humility standard than the league number, because 34 venues means 34 chances for a small sample to flatter itself, and these are not individually significance-tested.
What to do with all of this
Here is the practical list. Most of it is about what not to do, because in a game this noisy, avoiding mistakes pays better than hunting for genius.
Stop paying three. The folklore number has been wrong for the entire century. The real league figure is 2.31, the market currently charges 1.42, and everything interesting in NFL pricing right now lives in the 0.9 points between them.
Stop pricing every stadium the same. A flat home field number, any flat number, is wrong by up to two and a half points in both directions at once. It overcharges you at MetLife and undercharges you in Baltimore on the same Sunday.
Stop trusting raw home splits. Any home-field stat that has not been adjusted for roster strength is a story about quarterbacks wearing a stadium costume. That covers roughly every home-field stat you will hear on a broadcast this season, including the fortress you grew up believing in.
Stop giving shared stadiums full credit. Three roommate buildings in the sample, three below-average numbers, zero exceptions. Rams, Chargers, Giants, Jets: small numbers only.
Stop assuming a new building inherits the old one's number. Both stadium replacements in the sample opened weaker than what they replaced. Buffalo starts collecting its own data Thursday night. A lean, not a verdict, but the lean points down while the market points sideways.
Stop expecting any single edge to pay by itself. An 0.8 point lean against 13.5 points of noise is an ingredient. Our model carries venue-level home field as one input among many, and when it stacks with a power-rating edge at a good price, that is when a lean becomes a play. The bet is the recipe, never one ingredient.
Home field is alive. The price of it is still at the funeral. We know which side of that arrangement we want to stand on, and now you do too.
BTB, Seth
| Season | Games | Raw HFA | Adjusted HFA | Home win % | Market HFA | Actual minus Market |
|---|---|---|---|---|---|---|
| 2000 | 257 | +2.90 | +2.87 | 56.0% | +2.54 | +0.36 |
| 2001 | 259 | +2.17 | +2.27 | 55.6% | +2.33 | -0.16 |
| 2002 | 267 | +2.58 | +2.57 | 59.0% | +2.31 | +0.27 |
| 2003 | 267 | +3.59 | +3.59 | 61.4% | +2.53 | +1.06 |
| 2004 | 267 | +2.64 | +2.63 | 56.6% | +2.60 | +0.05 |
| 2005 | 267 | +3.53 | +3.88 | 58.4% | +2.57 | +0.95 |
| 2006 | 267 | +1.00 | +0.72 | 53.9% | +2.91 | -1.91 |
| 2007 | 267 | +2.93 | +2.93 | 56.9% | +2.66 | +0.27 |
| 2008 | 267 | +2.34 | +2.51 | 56.8% | +2.62 | -0.28 |
| 2009 | 267 | +2.40 | +2.38 | 57.3% | +2.65 | -0.25 |
| 2010 | 267 | +1.68 | +1.91 | 55.4% | +2.35 | -0.67 |
| 2011 | 267 | +3.47 | +3.38 | 57.3% | +2.51 | +0.96 |
| 2012 | 267 | +2.44 | +2.48 | 57.1% | +2.44 | +0.00 |
| 2013 | 267 | +2.91 | +2.98 | 59.8% | +2.52 | +0.39 |
| 2014 | 267 | +2.65 | +2.63 | 57.5% | +2.48 | +0.16 |
| 2015 | 267 | +1.60 | +1.88 | 54.3% | +2.14 | -0.54 |
| 2016 | 267 | +2.99 | +3.12 | 58.5% | +2.31 | +0.68 |
| 2017 | 267 | +2.58 | +2.48 | 56.9% | +2.11 | +0.47 |
| 2018 | 267 | +2.14 | +2.18 | 59.6% | +2.40 | -0.26 |
| 2019 | 267 | +0.04 | -0.11 | 52.3% | +1.91 | -1.87 |
| 2020 | 269 | +0.17 | +0.04 | 50.0% | +1.13 | -0.96 |
| 2021 | 285 | +1.93 | +1.78 | 51.8% | +1.82 | +0.12 |
| 2022 | 283 | +2.11 | +1.91 | 56.9% | +1.80 | +0.30 |
| 2023 | 285 | +2.92 | +2.78 | 56.5% | +1.79 | +1.13 |
| 2024 | 285 | +2.28 | +2.15 | 54.7% | +1.60 | +0.68 |
| 2025 | 285 | +2.03 | +2.11 | 53.5% | +1.42 | +0.61 |